By Mara Voss · Published August 4, 2026 · Updated August 5, 2026
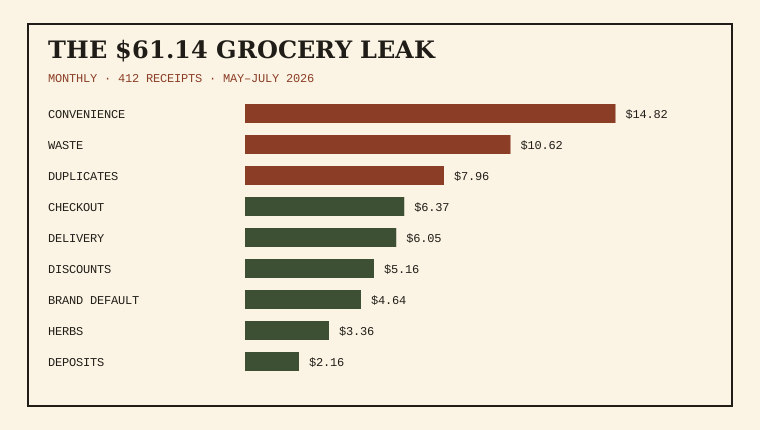
Nine small grocery habits—not one dramatic splurge—added $61.14 a month to our test household’s bill. Across 412 receipts collected from May 1 through July 29, 2026, convenience sizing, unused produce, duplicate pantry buys, and checkout extras did most of the damage. A receipt-first audit cut the measured leaks by 54% in the final month.
We tracked every food-shop receipt from two adults for 90 days, including supermarket runs, a warehouse store, a neighborhood produce market, and three grocery-delivery orders. The 412-receipt count includes small top-up trips and split receipts, not 412 full weekly shops. Total grocery spending was $2,184.76, or $728.25 per month. We excluded restaurants, household cleaners, pet food, and reimbursements.
Monthly cost of the nine recurring leaks, normalized from 90 days of receipts. Together they averaged $61.14.
How we turned receipts into evidence
On August 1, 2026, we matched each line item to a simple ledger with date, store, product, quantity, unit price, discount, and whether the food was used. For waste, we logged only items visibly discarded or spoiled; guesses did not count. For price comparisons, we used the cheaper size or substitute visible in the same store on the same day. That keeps the result grounded, though it does not claim every household can buy the same mix.
A “leak” had to repeat at least four times and have a plausible lower-cost alternative that did not require skipping a meal. Buying berries in season was not a leak. Buying a $3.79 pre-cut pineapple while whole pineapple was $2.49, six separate times, was. We normalized the 90-day totals to 30.44 days per month.
The nine grocery leaks found in 412 receipts
Leak
90-day cost
Monthly
Change tested
Convenience sizes and pre-cut food
$43.92
$14.82
Prep two items after shopping
Produce discarded unused
$31.47
$10.62
One “use first” refrigerator box
Duplicate pantry purchases
$23.58
$7.96
Photograph shelves before leaving
Checkout drinks and snacks
$18.87
$6.37
Bring water; use a written list
Delivery markups
$17.94
$6.05
Pickup for planned orders
Missed loyalty discounts
$15.30
$5.16
Check account at list-making time
Brand default when equivalent
$13.74
$4.64
Test one store brand per week
Single-use herbs
$9.96
$3.36
Freeze chopped leftovers
Bag and bottle deposits not returned
$6.39
$2.16
Keep returns beside shopping bags
The top three leaks were ordinary
Convenience sizing cost the most. The category included pre-cut produce, single-serve yogurt bought when a tub was cheaper per ounce, and snack packs assembled from familiar ingredients. We did not replace every convenience item. We kept two that reliably prevented skipped breakfasts and removed the ones purchased from habit. That distinction matters: a cheaper ingredient that goes unused is not a saving.
Waste came second at $10.62 monthly. Salad greens accounted for $8.41 of the 90-day waste total, followed by herbs and half-used vegetables. A shallow “use first” box moved vulnerable items into view. During July 2026, discarded produce fell from $13.26 to $5.04 without changing the grocery target.
Duplicate pantry buying was almost comical: three jars of cumin, two unopened bags of rice, and repeated canned tomatoes. A phone photo of the pantry before the weekly shop stopped six duplicate purchases in the final 30 days. No inventory app or barcode system survived our tired-Tuesday test; one photograph did.
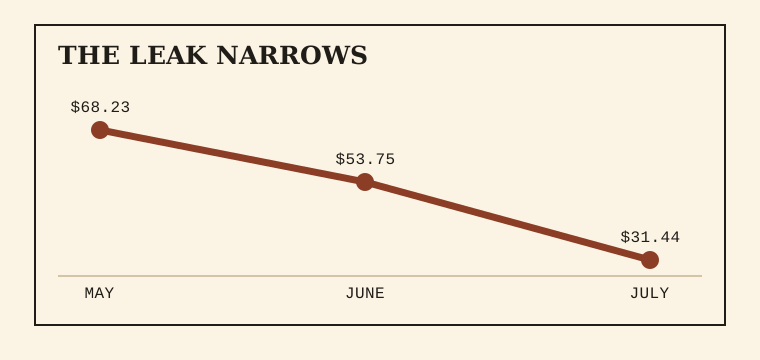
The observed monthly leak total fell after simple controls were introduced on June 15, 2026; total grocery spending also declined by $43.
What changed—and what did not
We introduced four controls on June 15: a refrigerator use-first box, a pantry photo, a list with quantities, and a ten-minute post-shop prep block. We also moved grocery money into a dedicated category, using the approach described in our plain-English budgeting glossary. Measured leaks dropped from $68.23 in May to $31.44 in July. Total grocery spending moved from $752.18 to $709.09.
We did not chase five stores for sale prices, abandon delivery during a difficult week, or replace foods people actually preferred. Store-brand tests saved $8.62 over 90 days, but one generic coffee was rejected after two cups. The usable saving is smaller than the theoretical maximum because adherence has a value.
The practical takeaway
Look below categories. A budgeting app can tell you groceries rose, but the receipt explains why. Start with 30 days, circle discarded food and add a mark beside anything already at home. Then choose the two largest repeat patterns. If you want software around that process, our eight-question budgeting-app guide explains when tracking helps and when a sheet or envelope is enough.
Our $61.14 is a measured case, not a national benchmark. Prices, diet, household size, transport, and access vary. The durable finding is structural: the largest opportunities were repeated, modest, and visible at line-item level. The budget showed the category; the receipts showed the repair.
Grocery Receipts FAQ
How many grocery receipts did you analyze?
We logged 412 receipts dated May 1 through July 29, 2026. Small top-up purchases and split receipts count separately. The dataset covered $2,184.76 in grocery food spending and excluded restaurants, cleaning supplies, pet food, and reimbursed purchases.
Did couponing create the $61 monthly saving?
No. Missed loyalty discounts represented only $5.16 of the monthly leaks. Most of the opportunity came from convenience formats, food waste, and duplicate purchases. The final controls required a pantry photo, a visible use-first box, a quantity list, and brief preparation—not extensive coupon work.
Can a budgeting app track grocery waste?
Not reliably by itself. An app sees the merchant and total, while waste and unit-price choices live on the receipt. Use an app for the grocery category and cash-flow limit, then add a 30-day receipt audit if the category keeps drifting.